LeakCanary是如何做到仅仅使用一句话做到内存泄漏检测的?
在leakcanary的faq.md中有一段解释
How does LeakCanary get installed by only adding a dependency?
On Android, content providers are created after the Application instance is created but before Application.onCreate() is called. The
leakcanary-object-watcher-androidartifact has a non exported ContentProvider defined in itsAndroidManifest.xmlfile. When that ContentProvider is installed, it adds activity and fragment lifecycle listeners to the application.
翻译过来就是:
在安卓中,ContentProvider被创建的时机处在Application被创建之后,但是在Application.onCreate()方法之前
所以,LeakCanary通过Gradle构建时会合并AndroidManifest.xml的机制,提供了一个ContentProvider在我们的软件里,当它被安装时,它便添加了相关refWatcher.
那么refWatcher是怎么做到的检测内存泄漏呢?
这又扯到我不是很熟悉的领域了
似乎是Java、Kotlin 语言有四种引用类型:强引用, 弱引用,软引用,虚引用,而软引用和弱引用所引用的对象被释放掉之后,就会进入关联的引用队列的尾部。那么我们就能通过这种方式来看这些弱引用的对象是否还存活
|
|
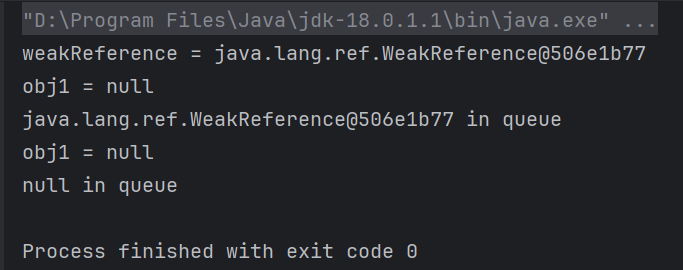
可以看到弱引用对象在引用队列中!
那就可以合理猜测LeakCanary在干什么了,它抢先在Application.onCreate()方法启动之前,然后对每个Activity的onDestoryed()方法注册回调,当一个Activity要被摧毁时,就创建一个对它的弱引用,同时关联一个引用队列。
那么我每间隔几秒就看一下我这个引用队列里有没有东西(如果这个对象成功释放,那么这个弱引用会进入引用队列)
有东西,就说明这个Activity被成功释放,那可以不管它了;没有东西,那问题就严重了,那说么这个Activity 可能存在内存泄漏 那我就要重点关注它了,把它移交到一个新的因素有严查队列中(监管级别更高的队列),每隔一段时间再检查,如果严查队列还没有东西,那我就认为发生了内存泄漏!
原理大致是这么个原理,我源码还没看,等我看完继续更新。。
Common causes for memory leaks
Most memory leaks are caused by bugs related to the lifecycle of objects. Here are a few common Android mistakes:
- Adding a
Fragmentinstance to the backstack without clearing that Fragment’s view fields inFragment.onDestroyView()(more details in this StackOverflow answer).- Storing an
Activityinstance as aContextfield in an object that survives activity recreation due to configuration changes.- Registering a listener, broadcast receiver or RxJava subscription which references an object with lifecycle, and forgetting to unregister when the lifecycle reaches its end.